Ch(T) for MRSM, ETABS Ready Data
Calculator Suggested by Er. Ranjeet Sahani – Structural Engineer
Inputs
Paste into ETABS. Define, Functions, Response Spectrum, User Defined.
Graph and Data
Curve styles. A red solid. B green dashed. C blue dotted. D black dash dot. Thin lines.
Spectral Shape Factor, Ch (T)
According to NBC, The Spectral Shape Factor, Ch(T) for the relevant soil type shall be obtained
either from Figure 4-2, or calculated by equation 4.1(2) using
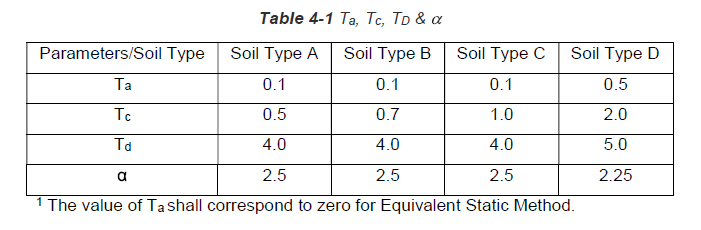
the parameters specified in Table 4.1. The spectral shape factor functions
given in Figure 4-1(b) shall be used for Modal Response Spectrum Method and
Nonlinear Time History Analysis.

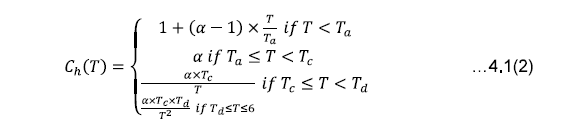
Where,
α = peak spectral acceleration normalized by PGA;
Ta = Lower limit of the constant spectral acceleration branch;
Tc = Upper limit of the constant spectral acceleration branch;
Td = Value defining the beginning of the constant displacement response
range of the spectrum